Age is one of the most interesting factors to consider when handicapping a UFC fight. Unlike…
How to Track Sports Betting ROI: Measuring Whether Your Strategy Actually Works

Winning bets is exciting, but winning bets does not necessarily mean you have a profitable sports betting strategy. A bettor might win six of their last ten wagers and still lose money, while another bettor could win fewer than half of their bets and finish with a profit. The difference often comes down to the odds, wager amounts, and overall return on investment. Tracking your sports betting ROI provides a clearer picture of whether your handicapping approach is producing positive results or simply benefiting from a temporary winning streak.
Many recreational bettors remember their biggest wins but struggle to account for every losing wager. Others keep track of their win-loss records without considering how much money they actually risked. Both approaches can create a misleading impression of success.
A consistent tracking system eliminates much of that uncertainty. By recording each wager, calculating net profits, and evaluating results over time, bettors can identify which strategies deserve further attention and which may need improvement.
The goal is not simply to determine whether you made money last weekend. It is to develop a reliable process for measuring performance across dozens, hundreds, or even thousands of wagers.
What Is Sports Betting ROI and Why Does It Matter?
Return on investment, commonly called ROI, measures how much profit or loss a bettor generates relative to the total amount wagered. It provides a standardized way to evaluate betting performance, regardless of whether someone typically wagers $10, $50, or $500 per game.
For sports betting, ROI is generally calculated by dividing net profit by the total amount wagered and multiplying the result by 100.
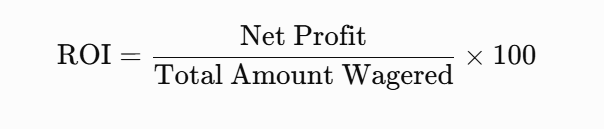
Net profit represents winnings minus losses, excluding the original stakes returned on winning bets. Total amount wagered represents the sum of all stakes placed during the period being evaluated.
Consider two bettors who each finish a season with $500 in profit.
The first bettor risked a combined $5,000 throughout the season, producing a 10% ROI. The second bettor risked $20,000 to generate the same $500 profit, producing a 2.5% ROI.
Although both bettors earned the same dollar amount, the first generated a substantially greater return relative to the money wagered.
This distinction becomes especially important when comparing betting strategies with different wager frequencies, average odds, or stake sizes.
ROI also differs from the percentage return on a starting bankroll. A bettor who begins with $1,000 and earns $200 has increased that starting bankroll by 20%, assuming no deposits or withdrawals. However, if that bettor placed $4,000 in total wagers throughout the season, the betting ROI would be 5%.
Both measurements provide useful information, but they answer different questions.
How to Calculate Sports Betting ROI Step by Step
Calculating ROI is relatively straightforward once you understand how sportsbooks handle winning and losing wagers. The most important distinction is between the total payout received from a winning bet and the actual profit earned.
Suppose a bettor places a $110 wager at -110 odds.
If the wager wins, the sportsbook returns the original $110 stake along with $100 in profit. The total payout is $210, but only $100 counts as profit.
If the wager loses, the bettor loses the entire $110 stake.
Now consider a hypothetical betting season with the following results:
| Performance Category | Amount |
| Total wagers placed | 100 |
| Total amount wagered | $5,000 |
| Total net profit | $250 |
| Average wager amount | $50 |
| Return on investment | 5% |
Using the ROI formula:
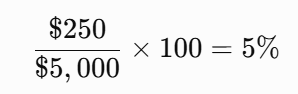
The bettor generated five cents in profit for every dollar wagered.
A negative ROI works the same way. If the bettor lost $250 instead of earning $250, the result would be -5%.
A push, where the wager is refunded, contributes zero profit or loss. For consistent accounting, refunded stakes should not be included in the total amount wagered used for the ROI calculation. Voided wagers should be treated similarly.
For example, if a bettor places a $50 wager that is later refunded, that wager should not influence the final ROI calculation.
The key is to apply the same accounting method throughout the entire tracking period.
How to Build a Sports Betting ROI Tracking Spreadsheet
A spreadsheet is one of the simplest and most effective tools for monitoring betting performance. Programs such as Microsoft Excel and Google Sheets allow bettors to record individual wagers, calculate profits automatically, and review results over different periods.
You do not need an advanced statistical background to build a useful betting tracker. A basic spreadsheet with several columns can provide most of the information necessary to evaluate your results.
Start by creating a new spreadsheet and entering the following headings across the first row. Each heading represents a piece of information that should be recorded whenever a wager is placed.
- Date: Record the date the wager was placed. This allows you to review betting activity by week, month, or season.
- Sport and event: Identify the league and matchup, such as an NFL game between two teams. This makes it easier to separate results by sport.
- Bet type: Record whether the wager was a moneyline, point spread, total, or another market.
- Strategy: Identify the handicapping method responsible for the wager. Use consistent names so you can compare results accurately.
- Odds: Enter the American odds accepted when the bet was placed, such as -110 or +150.
- Stake: Record the amount risked, not the potential payout.
- Result: Mark the wager as a win, loss, push, or void.
- Net profit or loss: Record the actual financial result, excluding the original stake returned on winning wagers.
Once these columns are established, each completed wager becomes a permanent record that can be reviewed later.
Example of a Completed Betting Log
The following example demonstrates how a simple tracking spreadsheet might look after four wagers.
| Date | Odds | Stake | Result | Net Profit/Loss |
| Oct. 1 | -110 | $55 | Win | +$50 |
| Oct. 3 | +150 | $40 | Loss | -$40 |
| Oct. 5 | +120 | $50 | Win | +$60 |
| Oct. 7 | -110 | $55 | Loss | -$55 |
| Total | $200 | +$15 |
The bettor risked a combined $200 and finished with $15 in profit.
Dividing $15 by $200 produces a 7.5% ROI.
Although that appears encouraging, four wagers are nowhere near enough to establish whether the bettor has a profitable long-term strategy.
Why You Should Track ROI Separately for Every Betting Strategy
One of the biggest advantages of maintaining detailed betting records is the ability to evaluate individual handicapping strategies rather than relying entirely on overall results.
Suppose you use three different systems throughout the season. One focuses on NFL underdogs, another identifies NBA totals opportunities, and a third evaluates NHL moneyline favorites.
At the end of the season, your overall record shows a small profit. Without separating the results, you might assume all three strategies are performing reasonably well.
However, reviewing each strategy individually could reveal a very different picture.
Consider the following hypothetical results:
| Betting Strategy | Total Wagered | Net Profit | ROI |
| NFL Underdogs | $2,000 | +$200 | +10% |
| NBA Totals | $1,500 | -$150 | -10% |
| NHL Moneylines | $1,500 | +$75 | +5% |
| Combined | $5,000 | +$125 | +2.5% |
The overall 2.5% return looks encouraging, but the NFL strategy generated most of the profits. Meanwhile, the NBA totals approach lost money.
This information can help determine where additional research is warranted.
For example, you could investigate whether the NBA losses were concentrated in particular situations, such as games involving back-to-back scheduling or certain odds ranges. You could also examine whether the NFL strategy performed consistently or benefited from a handful of unexpected results.
However, it would be premature to abandon the NBA strategy or increase wagers on NFL underdogs based on these totals alone. The number of bets, average odds, and natural variation in results must also be considered.
The purpose of tracking strategies separately is to identify meaningful questions worth investigating, not to assume that the best-performing system will automatically remain profitable.
Sports Betting Win Rate vs. ROI: Which Matters More?
Win percentage is one of the most commonly discussed measurements in sports betting. Although it provides useful information, it does not reveal whether a bettor is actually making money.
The reason is simple: different odds require different winning percentages to break even.
A bettor consistently wagering on heavy favorites must win a much higher percentage of games than someone regularly betting on underdogs.
Consider two hypothetical bettors who each place 100 wagers with a consistent $100 stake.
Bettor A wagers exclusively at -200 odds and wins 60 games. Each winning wager produces $50 in profit, resulting in $3,000 in winnings. However, the 40 losing wagers cost $4,000.
Despite winning 60% of the wagers, Bettor A finishes with a $1,000 loss and a -10% ROI.
Bettor B wagers exclusively at +150 odds and wins only 45 games. Each winning wager produces $150 in profit, generating $6,750. The remaining 55 losing wagers cost $5,500.
Bettor B finishes with a $1,250 profit and a 12.5% ROI.
The second bettor won fewer games but achieved a considerably better financial result.

Understanding Break-Even Win Percentages
Every betting price has a corresponding break-even win percentage. This represents the percentage of wagers that must win, on average, to avoid losing money at those odds, assuming consistent stake sizes.
The following table illustrates how break-even requirements change across common American odds.
| American Odds | Break-Even Win Rate |
| -200 | 66.67% |
| -150 | 60.00% |
| -110 | 52.38% |
| +100 | 50.00% |
| +120 | 45.45% |
| +150 | 40.00% |
| +200 | 33.33% |
A bettor wagering at -110 odds needs to win approximately 52.38% of those bets to break even before any additional fees.
Someone consistently wagering at +150 needs to win only 40% to break even.
This is why evaluating betting performance requires more than simply counting wins and losses. The odds accepted on each wager directly influence the profitability of the overall strategy.
How Many Bets Do You Need Before ROI Becomes Meaningful?
One of the most common mistakes in evaluating betting systems is drawing conclusions from too few wagers.
A strategy that produces excellent results over 20 bets may look completely different after 100. Similarly, a system that struggles during its first month could recover over a longer period.
This uncertainty is caused partly by variance, which describes the natural fluctuations that occur when outcomes are uncertain.
Even if a bettor consistently identifies wagers with positive expected value, losing streaks remain possible. A profitable long-term strategy does not guarantee profits over any particular week, month, or season.
Evaluating Different Sample Sizes
Although there is no universal number of bets that proves a strategy works, the following ranges provide a useful framework for understanding how much confidence to place in recorded results.
- 10–25 bets: Results are highly vulnerable to random variation. A few unexpected outcomes can dramatically change the overall return. At this stage, concentrate on accurate recordkeeping rather than profitability conclusions.
- 50–100 bets: Patterns may begin appearing, but the sample remains small. Review wager selection, average odds, and whether the original strategy rules were followed consistently.
- 200–500 bets: The larger record provides more information about performance, although substantial uncertainty remains, particularly when evaluating strategies with small expected advantages.
- 1,000 or more bets: A large sample offers a stronger foundation for statistical evaluation. However, even 1,000 wagers may not establish a small advantage with high confidence, especially when betting at longer odds.
These ranges are guidelines for organizing a review, not statistical thresholds that guarantee reliable conclusions.
For example, imagine a bettor places 100 wagers at approximately even-money odds and finishes with a 55% winning percentage.
That result is encouraging, but it does not establish that the bettor has a genuine 55% probability of winning future wagers.
The observed success could reflect handicapping ability, favorable randomness, or some combination of the two.
A more complete evaluation considers sample size, odds, market conditions, and whether the betting strategy was established before the results were recorded.
Why Closing Line Value Can Provide Additional Information
Closing line value, commonly abbreviated CLV, compares the odds accepted when a wager was placed with the market price shortly before the event begins.
Suppose you wager on an NFL team at +130 odds. By kickoff, the same team is available at +110.
Your original wager offers a larger potential profit than the closing price. This suggests that you obtained a favorable price relative to the market’s later assessment.
Tracking this difference across many wagers can provide additional information about your betting decisions.
However, closing line value is not proof of profitability. Markets can move for reasons unrelated to the actual outcome probabilities, and closing prices are not always perfectly efficient.
How to Review Your Betting ROI Every Month
Recording wagers is only the first part of the process. The real value comes from reviewing the information consistently and identifying changes in performance.
A monthly review provides a reasonable balance between monitoring results and avoiding emotional reactions to individual games.
Rather than examining your account balance after every loss, establish a regular review date. For example, you might evaluate your results on the first day of each month.
Begin by calculating total wagers, total amount risked, net profit, and ROI for the previous month. Compare those figures with your season-to-date results.
Next, separate the results by sport, wager type, and strategy.
This comparison may reveal that one approach has performed consistently across several months while another has experienced significant fluctuations.
It is also useful to compare actual wagers with your original strategy rules.
For example, if your system requires an underdog to meet three specific statistical conditions, determine whether every recorded wager satisfied those conditions. Bets placed outside the established criteria should be identified rather than quietly removed from the overall record.
Finally, record any observations in a monthly summary.
You might discover that a particular strategy has generated most of its profits at certain odds or that several losing wagers resulted from inconsistent bet selection.
These findings can guide future research, although changes should ideally be tested against new data rather than judged solely by historical results.
A monthly review should help you understand what happened and why further investigation may be necessary. It should not become an excuse to increase wager sizes after a profitable month or chase losses following a disappointing one.
Common Mistakes When Tracking Sports Betting ROI
Even a carefully designed spreadsheet can produce misleading results when the underlying information is incomplete or inconsistent.
Most tracking errors are not caused by complicated mathematics. They usually involve missing wagers, incorrect profit calculations, or inconsistent recordkeeping.
Understanding these mistakes can make your betting records more dependable.
Forgetting to Record Losing Wagers
A betting log must include every wager, not simply those that support a favorable performance record.
If you forget several losing bets, your spreadsheet may show a positive return even though your sportsbook account has declined in value.
The simplest solution is to record each wager immediately after placing it and update the result once the event concludes.
Confusing Total Payouts With Net Profit
A winning $100 wager at +150 returns $250, but the actual profit is only $150.
Recording the entire $250 as profit would substantially inflate your reported results.
Always subtract the original stake from the total payout before recording net profit.
Using Inconsistent Bet Sizes Without Recording Them
Some bettors calculate performance using the number of winning and losing wagers without accounting for different stake amounts.
This can become misleading when one wager risks $25 and another risks $200.
Recording the actual amount risked allows you to calculate a stake-weighted ROI that reflects your real financial results.
You can also track results in units to make comparisons easier.
Mixing Promotional Bets With Regular Wagers
Free bets, bonus credits, and sportsbook promotions may have different payout rules from ordinary cash wagers.
Combining them without adjustments can distort the performance of a handicapping strategy.
Maintain separate records for promotional activity or clearly identify those wagers so they can be excluded from a strategy-only analysis.
Changing Strategies After a Short Losing Streak
A few disappointing results do not necessarily mean a strategy has stopped working.
Before making changes, examine whether the losses reflect ordinary variance, changes in market conditions, or problems with the original handicapping assumptions.
If you revise a strategy, document the changes and evaluate the updated approach separately. This helps avoid repeatedly modifying a system until its historical results appear favorable.
Frequently Asked Questions About Sports Betting ROI
What Is a Good ROI in Sports Betting?
There is no universal percentage that guarantees a successful betting strategy. A sustained positive ROI of 2% to 5% can represent meaningful performance, particularly when supported by a large sample of wagers at commonly offered odds.
However, the number of bets, average odds, market type, and consistency of results are essential considerations. A 15% ROI after 20 wagers is much less convincing than a smaller positive return recorded over thousands of bets.
Can You Have a Positive ROI With a Losing Record?
Yes. Bettors who regularly wager on underdogs can finish with a positive return despite losing more bets than they win.
For example, a bettor who wins 45 of 100 wagers at +150 odds, risking $100 each time, would generate $1,250 in net profit and a 12.5% ROI.
The larger payouts on winning underdog wagers compensate for the greater number of losses.
Should You Track ROI in Dollars or Units?
Tracking both can be useful.
Dollar-based ROI reflects actual money risked and earned. Unit-based tracking helps standardize results when your typical wager amount changes.
For example, if one unit equals $25, a $50 wager represents two units.
When calculating ROI, make sure the profit and total stakes use the same measurement. Dividing profit in units by total units wagered produces the same percentage as using dollars, provided the unit value is consistent for those wagers.
How Often Should You Calculate Your Betting ROI?
A spreadsheet can update ROI automatically after every completed wager, but a weekly or monthly review is usually more useful for evaluating performance.
Frequent calculations are helpful for maintaining accurate records. Longer review periods reduce the temptation to overreact to individual outcomes.
For strategy evaluation, prioritize the total number of qualifying wagers and the quality of the underlying data rather than relying exclusively on calendar periods.
Conclusion: Use Your Betting Records to Make Better Decisions
Successful handicapping requires more than identifying winning teams. It also involves understanding the odds, managing wager amounts, and evaluating whether a strategy has produced favorable results over time.
Tracking sports betting ROI provides an objective measurement of profitability, helping bettors distinguish actual financial performance from misleading win-loss records or temporary winning streaks.
A well-maintained spreadsheet, consistent strategy classifications, and regular performance reviews can reveal information that would otherwise remain hidden.
However, positive historical results do not guarantee future profits. Even a carefully researched betting system can experience extended losing periods, and no tracking method eliminates the financial risks associated with wagering.
The most useful approach is to record every bet, evaluate results patiently, and allow evidence rather than emotion to guide your decisions. Set affordable wagering limits and never increase stakes simply to recover losses.
Over time, a disciplined tracking process can help you understand not only whether your strategy has made money, but also whether the available evidence supports continuing to use it.
Before You Go…
Get Weekly Winning Angles Delivered to You
Enjoy this article? Join the Core Sports Betting newsletter where we break down actionable strategies, betting angles, and real-game insights.
Some of the concepts we touch on each week can evolve into full handicapping systems – the kind you can test, refine, and potentially build into long-term edges.
Simple. Practical. No fluff.
Proven Sports Betting Courses
Looking to go deeper?
Our step-by-step courses are built around structured systems – not guesses or opinions. Each course has been backtested over a minimum of 10 years, giving you a clear understanding of how the strategy has performed over time.
If you’re serious about improving your process, these courses show you exactly how to approach betting with discipline and structure.
Free Betting Calculators to Sharpen Your Edge
Want to make smarter, faster decisions?
Our free tools help you quickly calculate odds, payouts, and true value — without the guesswork.
Try these popular calculators:
- Moneyline Calculator
- Parlay Calculator
- No-Vig Odds Calculator (Find True Odds)
- Kelly Criterion Calculator
→ Visit the Betting Tools Hub to access all calculators
Like this article? Pin it on Pinterest!


More to Explore