A team can dominate possession, generate plenty of scoring opportunities, and still lose several games because…
How to Calculate Expected Value in Sports Betting (With Examples)
Winning a sports bet feels great, but winning individual wagers is not necessarily the same as making profitable betting decisions. A bettor can correctly predict the outcome of a game and still accept odds that offer poor long-term value. Another bettor might lose a wager despite having made a mathematically sound decision. This distinction is one of the most important concepts to understand when evaluating sports betting opportunities.
Understanding expected value in sports betting helps bettors look beyond which team is most likely to win and consider whether the odds being offered justify the risk. Instead of focusing entirely on predicting winners, expected value provides a mathematical framework for comparing potential profits, losses, and estimated probabilities.
The concept applies to nearly every type of wager, including NFL point spreads, NBA moneylines, MLB totals, NHL puck lines, and even parlays. Although the calculations might initially seem complicated, the underlying idea is relatively straightforward.
In this guide, we will explain what expected value means, how to calculate it using American betting odds, and how to interpret the results. We will also examine practical examples, discuss common mistakes, and explore how expected value fits into a disciplined approach to sports betting.
What Is Expected Value in Sports Betting?
Expected value, commonly abbreviated as EV, represents the average amount a bettor would expect to win or lose per wager if the same betting opportunity could be repeated many times under identical conditions.
It is not a prediction of what will happen on any single bet. Instead, it describes the mathematical average of all possible outcomes, weighted by their probabilities.
For example, imagine a sportsbook offers +150 odds on an NBA team to win a game. At those odds, a successful $100 wager would produce $150 in profit, while an unsuccessful wager would lose the original $100 stake.
Now suppose you estimate that the team has a 45% probability of winning.
Because +150 odds require a winning percentage of only 40% to break even, your estimated probability suggests that the wager offers a mathematical advantage.
That is the basic idea behind positive expected value.
Expected value can fall into three categories:
- Positive expected value (+EV): The estimated probability of winning is high enough relative to the offered odds that the wager has a positive theoretical average return. For example, a $100 bet with an expected value of +$8 represents an estimated average profit of $8 per wager over repeated comparable opportunities.
- Negative expected value (-EV): The odds do not provide enough potential profit to compensate for the estimated probability of losing. A wager with an EV of -$6 per $100 staked represents an estimated average loss of $6 per wager.
- Zero expected value: The estimated probability and payout are exactly balanced. The theoretical average profit is zero, meaning the bettor has neither a mathematical advantage nor disadvantage under the assumed probabilities.
Most sportsbook wagers have negative expected value when probabilities are accurately estimated from efficient markets, largely because sportsbooks incorporate a margin into their prices.
Finding a positive-value opportunity requires identifying situations where the available odds are more favorable than the estimated probability suggests they should be.
The Expected Value Sports Betting Formula
The mathematics behind expected value is based on two possible outcomes: winning the wager or losing it.
For a standard wager that either wins or loses, the formula is:
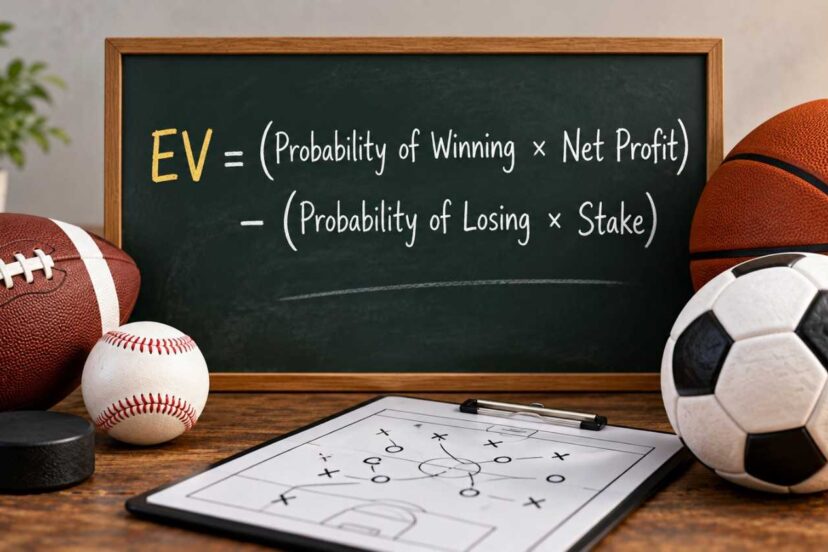
EV = (Probability of Winning × Net Profit) − (Probability of Losing × Stake)
Each part of the formula represents an important component of the betting decision:
- EV: Expected value, expressed as an estimated dollar profit or loss.
- Probability of Winning: The estimated probability of winning, written as a decimal. A 55% probability becomes 0.55.
- Net Profit: The profit earned if the wager wins, excluding the original stake returned by the sportsbook.
- Probability of Losing: The estimated probability of losing, also expressed as a decimal.
- Stake: The amount of money risked on the wager.
Because a standard wager has only two possible outcomes, the probability of losing is calculated by subtracting the probability of winning from 1.
For example, if the estimated winning probability is 45%, the estimated losing probability is 55%.
Expected Value Calculation Example
Suppose you are considering a $100 wager on an NHL underdog at +150 odds.
You estimate that the team has a 45% probability of winning.
The potential net profit is $150, while the potential loss is $100.
Substituting those figures into the formula gives:
EV = (0.45 × $150) − (0.55 × $100)
EV = $67.50 − $55.00
EV = +$12.50
This wager has an estimated expected value of +$12.50 per $100 staked.
That does not mean you will earn $12.50 when placing the bet. You will either win $150 or lose $100.
Instead, the calculation indicates that if your probability estimate is accurate and you could repeatedly encounter comparable opportunities, the average profit would theoretically approach $12.50 per $100 wagered over a sufficiently large sample.
Expected Value as a Percentage
Expected value can also be expressed as a percentage of the amount risked.
The formula is:
EV% = (Expected Value ÷ Stake) × 100
Using the previous example:
EV% = ($12.50 ÷ $100) × 100
EV% = 12.5%
The wager has an estimated expected return of 12.5% on the amount staked.
Expressing EV as a percentage is especially useful when comparing bets with different stake sizes. A $25 wager and a $200 wager can have the same EV percentage even though their expected dollar returns are different.
For wagers that can push, such as certain point spreads and totals, the calculation must also account for the probability of a push. A push generally returns the stake and contributes zero net profit or loss.
How to Calculate Expected Value in Sports Betting Step by Step
Once you understand the formula, the next challenge is applying it to actual betting odds. The calculation becomes easier when you separate the process into a few steps.
Let’s use an NFL point spread as an example.
Imagine a sportsbook lists the following wager:
NFL Team A -3.5 (-110)
You want to risk $110 on Team A covering the spread. Based on your analysis, you estimate that Team A has a 55% chance of covering.
Here is how to evaluate the wager.
Step 1: Identify the Sportsbook Odds
The sportsbook is offering -110 odds.
With negative American odds, the number indicates how much you must risk to earn $100 in profit.
At -110, a $110 wager produces $100 in net profit if successful.
Understanding the payout is essential because the expected value formula uses net profit, not the total amount returned.
Step 2: Convert the Odds Into Implied Probability
Implied probability represents the break-even winning percentage associated with the sportsbook’s odds.
For negative American odds, use:
Implied Probability = |Odds| ÷ (|Odds| + 100) × 100
For -110:
110 ÷ 210 × 100 = 52.38%
You would need to win approximately 52.38% of comparable -110 wagers to break even.
For positive American odds, use:
Implied Probability = 100 ÷ (Odds + 100) × 100
For example, +150 odds have an implied probability of 40%.
These calculations convert betting prices into probabilities. They do not establish the actual probability of a team winning, and the sportsbook’s margin can affect the prices offered.
Step 3: Estimate the Actual Winning Probability
This is the most difficult part of expected value analysis.
In our NFL example, you estimate that Team A has a 55% chance of covering the spread.
That estimate should come from meaningful analysis rather than personal preference or confidence in a particular team.
Potential inputs include offensive efficiency, defensive performance, injuries, opponent quality, recent results, and relevant matchup characteristics.
The more reliable your estimate, the more meaningful the expected value calculation becomes.
Step 4: Calculate the Potential Profit and Loss
With a $110 wager at -110 odds, the outcomes are straightforward.
A winning wager produces $100 in profit. A losing wager costs $110.
The estimated probability of winning is 55%, while the estimated probability of losing is 45%.
Step 5: Apply the Expected Value Formula
Now insert the numbers:
EV = (0.55 × $100) − (0.45 × $110)
EV = $55 − $49.50
EV = +$5.50
The estimated expected value is +$5.50 per $110 wagered.
As a percentage of the amount risked:
EV% = ($5.50 ÷ $110) × 100
EV% = 5%
Step 6: Interpret the Result
The calculation suggests that the wager has a 5% theoretical advantage based on your estimated probability.
However, that advantage exists only if your 55% probability estimate is accurate.
If Team A actually has a 51% chance of covering, the same wager would have negative expected value.
This is why probability estimation deserves as much attention as the mathematical calculation itself.
Positive vs. Negative Expected Value: Three Betting Examples
The easiest way to understand expected value is to compare wagers across different sports. A bet does not automatically become valuable because it offers attractive odds, involves a strong favorite, or has a high probability of winning.
What matters is the relationship between the estimated winning probability and the amount the sportsbook pays.
The following examples use hypothetical probabilities for illustration. They are not recommendations for actual games.
Example 1: NFL Point Spread at -110
Suppose an NFL team is listed at -110 to cover a 3.5-point spread.
You estimate that the team has a 55% chance of covering.
For a $100 wager, the potential net profit is approximately $90.91.
EV = (0.55 × $90.91) − (0.45 × $100)
EV = $50.00 − $45.00
EV = +$5.00
The wager has an estimated positive expected value of approximately $5 per $100 risked, representing a 5% theoretical return.
Although the estimated winning percentage is only slightly higher than the 52.38% break-even requirement, that difference is enough to create positive EV.
Example 2: NBA Underdog at +150
Imagine an NBA underdog is available at +150.
Your analysis suggests that the team has a 45% chance of winning outright.
A $100 wager would produce $150 in profit if successful.
EV = (0.45 × $150) − (0.55 × $100)
EV = $67.50 − $55.00
EV = +$12.50
This wager has an estimated EV of +12.5%.
Notice that the team is more likely to lose than win. Nevertheless, the potential payout is large enough to make the wager mathematically favorable under the assumed probability.
This illustrates why positive expected value does not require betting on favorites or consistently selecting the most likely winner.
Example 3: MLB Favorite at -150
Now consider an MLB favorite listed at -150.
You estimate that the team has a 55% chance of winning.
A $100 wager at -150 produces approximately $66.67 in profit.
EV = (0.55 × $66.67) − (0.45 × $100)
EV = $36.67 − $45.00
EV = -$8.33
The wager has an estimated negative expected value of $8.33 per $100 risked.
Although the team is more likely to win than lose, the payout does not adequately compensate for the possibility of losing.
The sportsbook’s -150 price requires a 60% winning probability to break even, while your estimate is only 55%.
Comparing the Three Wagers
| Wager | Odds | Estimated Win Probability | EV per $100 |
| NFL point spread | -110 | 55% | +$5.00 |
| NBA moneyline | +150 | 45% | +$12.50 |
| MLB moneyline | -150 | 55% | -$8.33 |
These examples demonstrate an important principle: A bet’s value depends on the price being offered, not simply the likelihood of winning.
A bettor who understands this distinction can evaluate wagers more consistently without relying entirely on favorites, recent winning streaks, or personal expectations.
How to Estimate the True Probability of a Bet
Calculating expected value in sports betting is relatively simple once the necessary numbers are available. The real challenge is estimating the probability of an outcome accurately enough to identify a meaningful advantage.
A mathematical formula cannot correct an unrealistic probability estimate. If a bettor assumes a team has a 65% chance of winning when its actual probability is closer to 48%, the resulting EV calculation will be misleading.
Developing a reasonable probability estimate requires research, consistency, and an understanding of the factors that influence individual sporting events.
Several methods can help bettors develop and evaluate their estimates.
Analyze Relevant Team and Player Statistics
Begin by identifying statistics that directly relate to the wager being considered.
For an NFL point spread, useful information might include yards per play, offensive efficiency, defensive efficiency, turnover rates, and performance against similar opponents.
For an NBA wager, offensive rating, defensive rating, effective field goal percentage, rebounding, and pace may provide useful context.
In baseball, starting pitching, bullpen availability, offensive production, and park factors can influence projected outcomes.
The goal is not to collect as many statistics as possible. Instead, focus on measurements that have a reasonable relationship with the specific betting market.
Account for Injuries and Matchup Conditions
Statistics describe what has already happened, but upcoming games may involve different circumstances.
A basketball team missing its starting center could experience changes in rebounding, interior defense, and offensive efficiency.
An NFL team playing without multiple offensive linemen may struggle against an opponent with a strong pass rush.
Weather can also influence certain wagers, particularly outdoor football and baseball games.
Evaluate whether the available statistics still represent the team that will actually compete. Avoid making arbitrary adjustments without evidence of how much a particular absence or condition affects performance.
Compare Sportsbook Odds and Remove the Vig
Sportsbook prices can provide a useful starting point for estimating probabilities.
However, the odds generally include a built-in margin known as the vig, or juice.
Imagine both sides of an NFL point spread are priced at -110.
Each side carries an implied probability of approximately 52.38%.
Adding those probabilities produces:
52.38% + 52.38% = 104.76%
Because the two outcomes cannot have a combined true probability greater than 100%, the additional 4.76 percentage points represent the market’s overround.
A basic no-vig calculation removes this margin by dividing each implied probability by the combined total.
52.38 ÷ 104.76 × 100 = 50%
This produces a 50% no-vig probability for each side.
For markets with unequal prices, the same proportional approach produces different no-vig probabilities for the competing outcomes.
This is a useful benchmark, but no-vig probabilities are still market-derived estimates rather than guaranteed true probabilities. Different methods of removing the margin can also produce slightly different results.
You can use the CoreSportsBetting No-Vig Calculator to simplify this process.

Test Your Probability Estimates Over Time
One of the most useful habits is recording your estimated probabilities before games begin and comparing them with subsequent results.
For example, if you assign a 60% probability to 100 different wagers, approximately 60 of those outcomes should win if your estimates are well calibrated and the sample is representative.
That does not mean exactly 60 must win. Random variation can produce different results, even when the estimates are reasonable.
Over larger samples, compare groups of predictions with similar probabilities. If outcomes assigned a 60% probability consistently win much less frequently, your estimates may be too optimistic.
This process can help identify weaknesses in your analysis and improve future probability estimates.
Why Expected Value Matters More Than Win Percentage
Many bettors evaluate their performance primarily by looking at how often their wagers win.
Although winning percentage is important, it does not tell the complete story.
A bettor who wins 60% of wagers can lose money if the odds are unfavorable. Another bettor might win only 45% of wagers and still produce a profit if the payouts are sufficiently large.
Consider two hypothetical betting strategies, each involving 100 wagers of $100.
Strategy A: 60% Win Rate at -200 Odds
Strategy A wins 60 wagers at -200 odds, earning $50 in profit on each victory. Its 40 losses cost $100 apiece.
Total winnings: 60 × $50 = $3,000
Total losses: 40 × $100 = $4,000
Net result: -$1,000
Despite winning 60% of its wagers, Strategy A loses money because the payouts are insufficient to cover the losses.
Strategy B: 45% Win Rate at +150 Odds
Strategy B wins only 45 wagers, but each successful $100 wager at +150 earns $150 in profit.
Total winnings: 45 × $150 = $6,750
Total losses: 55 × $100 = $5,500
Net result: +$1,250
The second strategy wins fewer than half its wagers but produces a better financial outcome because the odds are more favorable relative to its winning percentage.
Break-Even Winning Percentages for Common Betting Odds
Understanding break-even percentages makes it easier to recognize whether a potential wager deserves further analysis.
The table below shows how frequently a bettor must win at various American odds to break even over time, assuming the same odds are repeatedly available and there are no pushes or additional fees.
| American Odds | Break-Even Win Rate |
| -200 | 66.67% |
| -150 | 60.00% |
| -110 | 52.38% |
| +100 | 50.00% |
| +150 | 40.00% |
| +200 | 33.33% |
These percentages provide a useful reference when comparing wagers.
For example, if you estimate that a team has a 42% chance of winning, +150 odds would theoretically offer positive value because the break-even requirement is 40%.
At +120 odds, however, the same team would need to win approximately 45.45% of the time to break even.
The estimated probability has not changed, but the available price has changed the expected value.
Common Mistakes When Calculating Expected Value
Even when bettors understand the formula, several mistakes can lead to inaccurate conclusions.
Most of these errors involve misunderstanding probability, overlooking betting costs, or placing too much confidence in a small amount of information.
Recognizing these problems is an important part of developing a consistent evaluation process.
1 – Overestimating Winning Probability
One of the easiest mistakes is assigning overly optimistic probabilities to teams or players you already expect to perform well.
For example, you might believe an NFL team has a 65% chance of winning because it has performed well recently.
However, that estimate may overlook opponent strength, injuries, or the possibility that the sportsbook has already accounted for the team’s recent performance.
Before assigning a probability, review the available evidence and compare your estimate with market-based benchmarks.
If your estimate differs substantially from the market, identify a specific, defensible reason for the difference.
2 – Confusing Total Payout With Net Profit
Sportsbooks generally return the original stake along with the winnings when a bet is successful.
For example, a $100 wager at +150 returns $250 in total.
However, only $150 represents profit.
Using $250 as the winning amount in the expected value formula would substantially overstate the wager’s potential return.
Always separate the original stake from the net profit before performing the calculation.
3 – Ignoring the Sportsbook’s Vig
The sportsbook’s margin can make a meaningful difference, particularly when comparing prices that appear similar.
Consider an NFL spread available at -110 at one sportsbook and -105 at another.
At -110, the break-even percentage is approximately 52.38%.
At -105, it falls to approximately 51.22%.
That difference may appear small, but repeatedly obtaining more favorable odds improves the mathematical return when the underlying probability remains unchanged.
Compare available prices before placing a wager rather than automatically accepting the first line you see.
4 – Assuming Positive EV Guarantees a Win
A positive expected value wager can lose, and a negative expected value wager can win.
Expected value describes an average mathematical outcome, not a prediction of the next result.
A team with a genuine 55% chance of winning still has a 45% chance of losing.
Even a well-supported betting strategy can experience extended losing streaks.
Avoid judging a wager solely by whether it wins. Instead, evaluate whether the original probability estimate and available price justified the decision.
5 – Relying on Small Samples
A betting strategy that wins eight of its first ten wagers may appear highly effective.
However, ten wagers provide very little information about its actual long-term winning probability.
Random variation can produce impressive short-term results without indicating a genuine advantage.
Track results over a larger number of wagers and separate performance by market, odds range, and betting strategy.
Also consider whether your probability estimates remain accurate when tested against new games rather than only historical data used to develop the strategy.
How Expected Value Works With Bankroll Management
Identifying a wager with positive expected value is only one part of managing sports betting decisions.
Even a strategy with a genuine mathematical advantage can experience significant losses over short periods.
For that reason, bankroll management should be considered alongside expected value rather than treated as a separate concern.
A betting bankroll is a predetermined amount of money set aside specifically for wagering. It should consist only of money a bettor can afford to lose without affecting essential expenses or financial obligations.
There are several ways to structure wager sizes, but the following principles provide a practical starting point.
- Establish a dedicated bankroll. Decide on a fixed amount that is separate from money needed for housing, bills, savings, and other responsibilities. For example, someone with a $1,000 discretionary betting bankroll might use that amount as the basis for calculating wager sizes rather than increasing deposits after losses.
- Use consistent stake sizes. A flat-betting approach risks the same amount on each wager. Someone choosing a 1% unit size with a $1,000 bankroll would risk $10 per bet. This can make results easier to track and helps prevent a single opinion from determining an excessive portion of the bankroll.
- Avoid increasing wagers to recover losses. Losing several consecutive bets does not make the next wager more likely to win. Evaluate each opportunity independently rather than increasing the stake because of previous results.
- Track expected and actual returns. Record the odds, stake, estimated probability, calculated EV, and final result for every wager. Reviewing these records can help determine whether your estimates are consistently realistic.
A positive EV calculation should never be interpreted as permission to risk more money than you can comfortably afford to lose.
The goal of bankroll management is to control exposure and preserve the ability to make independent decisions despite normal fluctuations in results.
Frequently Asked Questions About Expected Value in Sports Betting
What Is a Good Expected Value Percentage in Sports Betting?
Any genuinely positive expected value indicates a theoretical mathematical advantage.
For example, a wager with an estimated EV of +3% would produce an average theoretical profit of $3 for every $100 risked across repeated comparable opportunities.
However, a calculated 10% EV is not necessarily better than a calculated 3% EV if the larger estimate is based on unreliable assumptions.
The accuracy of the probability estimate matters more than the size of the number alone.
Can a Positive EV Bet Still Lose?
Yes. A positive expected value wager can lose even when the probability estimate is completely accurate.
If a team has a 60% chance of winning, it still has a 40% chance of losing.
Expected value becomes meaningful when evaluating the average results of repeated opportunities, not when predicting individual outcomes.
Is Expected Value the Same as Implied Probability?
No. Implied probability is the break-even probability associated with a particular betting price.
Expected value combines an estimated actual probability with the potential profit and loss to calculate a theoretical average return.
Implied probability helps establish the price a bettor must overcome. Expected value evaluates whether the estimated probability is favorable relative to that price.
Does Expected Value Work for Parlays?
Yes. Expected value can be calculated for parlays, but determining the probability of winning the entire wager requires additional consideration.
For a parlay involving independent events, multiply the estimated probabilities of the individual legs to determine the probability that every selection wins.
For example, two independent outcomes with 60% winning probabilities would have a combined probability of:
0.60 × 0.60 = 0.36
The parlay would have an estimated 36% chance of winning.
However, some parlay selections are correlated, meaning their outcomes are related. In those situations, simply multiplying the individual probabilities may produce an inaccurate result.
Once the combined probability is estimated, it can be compared with the parlay’s potential payout using the same expected value formula.
Conclusion
Understanding expected value in sports betting changes the way wagers can be evaluated. Rather than focusing exclusively on which team is most likely to win, bettors can examine whether the available odds offer enough potential profit to justify the estimated risk.
The formula itself is straightforward, but reliable probability estimates, careful price comparisons, and disciplined bankroll management are essential to using it responsibly.
Positive expected value does not guarantee winning results, and even favorable mathematical opportunities can produce losses. However, learning to distinguish between probability and price provides a more consistent framework for evaluating betting decisions.
By combining sound analysis with a clear understanding of expected value, bettors can make more informed decisions and better understand the mathematical risks associated with every wager.
Before You Go…
Get Weekly Winning Angles Delivered to You
Enjoy this article? Join the Core Sports Betting newsletter where we break down actionable strategies, betting angles, and real-game insights.
Some of the concepts we touch on each week can evolve into full handicapping systems – the kind you can test, refine, and potentially build into long-term edges.
Simple. Practical. No fluff.
Proven Sports Betting Courses
Looking to go deeper?
Our step-by-step courses are built around structured systems – not guesses or opinions. Each course has been backtested over a minimum of 10 years, giving you a clear understanding of how the strategy has performed over time.
If you’re serious about improving your process, these courses show you exactly how to approach betting with discipline and structure.
Free Betting Calculators to Sharpen Your Edge
Want to make smarter, faster decisions?
Our free tools help you quickly calculate odds, payouts, and true value — without the guesswork.
Try these popular calculators:
- Moneyline Calculator
- Parlay Calculator
- No-Vig Odds Calculator (Find True Odds)
- Kelly Criterion Calculator
→ Visit the Betting Tools Hub to access all calculators
Like this article? Pin it on Pinterest!


More to Explore