
Golf tournaments present bettors with a challenge that is different from many other sports. The playing…
NFL Betting Using Red Zone TD Percentage Instead of Total Yards
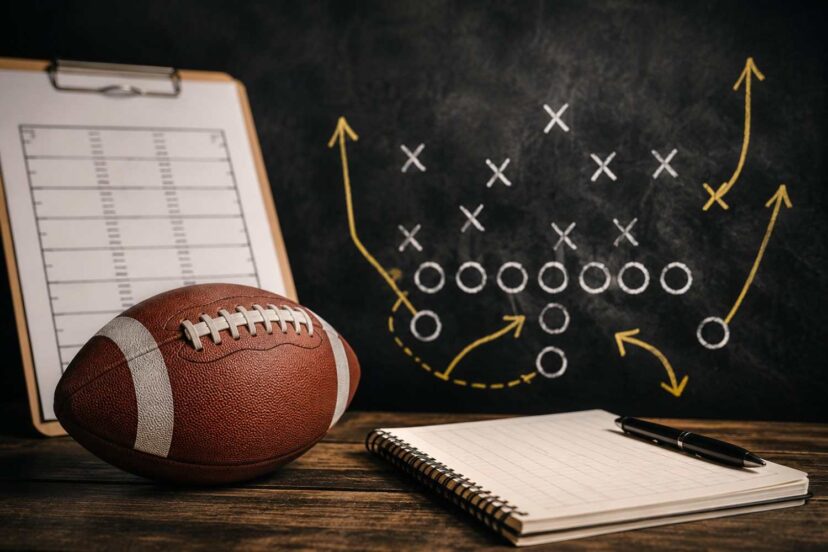
Every NFL season, bettors spend countless hours studying statistics before placing a wager. Passing yards, rushing yards, yards per play, and total offense dominate pregame discussions because they are easy to find and appear to tell the story of how well a team performs. While those numbers certainly have value, they do not always explain why one team consistently covers the spread while another falls short despite moving the football effectively.
One statistic that deserves much more attention is NFL red zone touchdown percentage betting. Instead of focusing on how many yards an offense accumulates, this approach centers on how efficiently a team turns scoring opportunities into touchdowns. After all, football games are decided by points rather than yards. An offense that marches between the 20-yard lines but repeatedly settles for field goals often looks impressive statistically while failing to reward bettors.
Using NFL red zone touchdown percentage betting allows you to identify offenses that consistently finish drives and defenses that struggle to prevent touchdowns near the goal line. This perspective often reveals strengths and weaknesses that are hidden when looking only at total offensive production. Teams with average yardage can become profitable betting opportunities if they excel in the red zone, while high-powered offenses may be overvalued if they frequently stall inside the opponent’s 20-yard line.
Throughout this article, we’ll explore why red zone touchdown percentage is such an important metric, how it differs from total yardage, and how you can incorporate it into your weekly handicapping routine. By understanding the difference between moving the football and actually finishing drives, you’ll add another valuable tool to your NFL betting strategy.
What Is Red Zone TD Percentage?
Before applying any statistic to sports betting, it’s important to understand exactly what it measures and why it matters. Red zone touchdown percentage is straightforward on the surface, but many bettors confuse it with other red zone statistics that tell a slightly different story.
The red zone refers to the area inside an opponent’s 20-yard line. Once an offense reaches this part of the field, the objective shifts from simply gaining yards to finding a way into the end zone. Defenses have less field to protect, making passing windows smaller and running lanes tighter. Success in this area often comes down to execution, coaching, play design, and physical play at the line of scrimmage.
Red zone touchdown percentage measures how often an offense scores a touchdown after reaching the red zone. This differs from red zone scoring percentage, which includes both touchdowns and field goals. While scoring points is always better than coming away empty-handed, bettors should recognize that touchdowns have a much greater impact on point spreads and totals than field goals.
Imagine two offenses that each reach the red zone five times during a game.
The first offense scores five touchdowns.
The second offense kicks five field goals.
Both teams technically scored on every red zone possession, but the difference in production is enormous. One team scored 35 points from those opportunities, while the other managed only 15. That twenty-point difference illustrates why touchdown percentage provides much more meaningful insight than simply knowing whether a team scored.
This distinction becomes even more valuable over an entire season. Teams that consistently finish drives with touchdowns generally create larger margins of victory and put themselves in stronger positions to cover betting lines. Teams that repeatedly settle for field goals often leave points on the field, allowing opponents to remain within striking distance.
Several factors influence a team’s red zone touchdown percentage.
Quarterback decision-making becomes increasingly important because passing windows shrink dramatically inside the 20-yard line. Mobile quarterbacks may create additional scoring opportunities by extending plays or running for touchdowns themselves.
Running backs also play a larger role near the goal line. Some teams possess powerful runners who excel in short-yardage situations, while others struggle to gain tough yards against stacked defensive fronts.
Offensive line play is another critical component. A line capable of creating push near the goal line often turns first-and-goal situations into touchdowns instead of difficult third-down decisions.
Play calling deserves attention as well. Creative offensive coordinators frequently design formations and motion packages specifically for the red zone. Teams with predictable play calling often become easier for defenses to stop when the field becomes compressed.
Coaching philosophy can also affect touchdown percentage. Some coaches become conservative inside the 20-yard line, preferring to avoid mistakes and secure three points. Others aggressively pursue touchdowns, even if that occasionally results in turnovers on downs.
Because so many elements influence success inside the red zone, touchdown percentage becomes a useful summary statistic that captures overall offensive efficiency where it matters most.
For bettors, this statistic helps answer a simple but powerful question:
Can this offense finish drives?
That question often proves more valuable than asking how many total yards the offense gains each week.
Why Total Yards Can Fool Bettors
Total offensive yardage has long been one of the most referenced statistics in football. Television broadcasts display it throughout every game, sportsbooks mention it in previews, and many bettors naturally assume that the team gaining more yards is likely to win. While there is certainly a relationship between yardage and success, relying on total offense alone can lead to misleading conclusions.
One of the biggest reasons is that yards and points are not perfectly connected. Teams can move the football efficiently for much of the afternoon yet repeatedly fail to capitalize once they approach the goal line. When that happens, impressive offensive statistics create an illusion of dominance that isn’t reflected on the scoreboard.
Imagine a team that gains 460 total yards during a game.
At first glance, that appears to be an elite offensive performance.
However, suppose that same team commits a turnover inside the 10-yard line, misses a short field goal, settles for three field goals after reaching first-and-goal situations, and throws an interception near the goal line late in the fourth quarter.
Despite nearly 500 yards of offense, the final score may show only 20 points.
Meanwhile, the opposing team gains just 325 yards but scores touchdowns on every red zone opportunity, finishing with 31 points and covering the spread comfortably.
Looking only at total yardage would suggest the losing team played better offensively. Looking at scoring efficiency tells an entirely different story.
Another reason yardage can be deceptive is game flow.
A team trailing by multiple scores often accumulates significant passing yards during the second half because the defense shifts into softer coverage designed to prevent quick touchdowns. Those late yards inflate season averages without necessarily improving the team’s chances of winning or covering future betting lines.
Penalties can also distort total yardage. A long completion wiped out by holding adds no official passing yards despite demonstrating offensive capability. On the other hand, repeated penalties inside the red zone may prevent touchdowns even after long drives.
Turnovers present another challenge.
An offense may drive 75 yards with ease only to lose a fumble at the goal line. Statistically, those yards remain on the books, but the drive produces zero points.
Red zone efficiency captures that failure far better than total offense.
Personnel also matters.
Some teams feature explosive wide receivers capable of generating long gains between the 20-yard lines but lack a reliable power running game needed near the goal line. Others possess dominant tight ends who become nearly unstoppable in confined spaces, allowing them to score touchdowns despite producing fewer explosive plays throughout the game.
Weather conditions create additional complications.
High winds or heavy rain may reduce passing efficiency while increasing the importance of running the football inside the red zone. Teams built for physical football often maintain their touchdown efficiency even when total yardage declines under poor weather conditions.
Sportsbooks and the betting public frequently pay close attention to teams that rank near the top of the league in total offense. Those rankings create narratives that influence betting markets throughout the season. However, teams with flashy yardage statistics but mediocre red zone production can become overvalued because the public naturally equates yards with points.
This is where NFL red zone touchdown percentage betting begins to separate informed bettors from those relying solely on traditional statistics. By looking beyond raw offensive production, you gain a clearer understanding of which teams consistently maximize their scoring opportunities and which teams leave valuable points on the field.
Many successful handicappers don’t ignore total yards—they simply place those numbers within a broader context. Yardage helps identify a team’s ability to move the football, while red zone touchdown percentage reveals whether that movement translates into the one outcome that matters most: touchdowns.
When evaluating NFL games each week, remember that the objective isn’t to predict which team gains the most yards. The goal is to predict which team scores the most points. Red zone efficiency often provides a much more direct path toward answering that question.
Why Touchdowns Matter More Than Yardage
One of the simplest ways to improve your NFL handicapping is to shift your focus from how many yards a team gains to how efficiently it converts opportunities into points. Yardage helps move the football, but touchdowns win games. That distinction may seem obvious, yet many bettors continue to place too much emphasis on offensive rankings based solely on total yards.
Think about two hypothetical teams over a four-week stretch.
Team A averages 425 total yards per game, ranking among the league leaders. However, once it reaches the opponent’s 20-yard line, the offense frequently stalls. Perhaps the offensive line struggles to create space in short-yardage situations, or the quarterback forces throws into tight coverage. The result is a series of field goals instead of touchdowns.
Team B averages only 340 yards per game. Its offense is less explosive between the 20-yard lines, but once it reaches the red zone, it executes exceptionally well. The running game becomes more effective near the goal line, receivers create separation in condensed spaces, and the coaching staff consistently calls successful plays.
Which team would you rather back?
Many casual bettors instinctively choose Team A because the yardage numbers appear far more impressive. Yet Team B may actually score more points each week despite gaining nearly 100 fewer yards.
That example illustrates why efficiency often outweighs volume. Football rewards teams that capitalize on scoring opportunities, not necessarily those that generate the most offensive production.
Another reason touchdowns matter more than yardage is how they influence momentum throughout a game. A touchdown at the end of a long drive energizes the offense while placing additional pressure on the opposing team. Field goals, although valuable, often leave the door open for opponents to respond quickly with a single touchdown.
Imagine an offense that reaches the red zone four times.
If all four possessions end in field goals, the team scores 12 points.
If those same four drives produce touchdowns, the offense scores 28 points before extra-point attempts are even considered.
That difference changes everything from game strategy to live betting opportunities. Teams forced to settle for field goals often find themselves chasing points later in games, which can alter play calling and increase mistakes.
Touchdowns also play a significant role in covering point spreads. A favorite laying seven points benefits tremendously from turning red-zone trips into touchdowns rather than field goals. Likewise, underdogs capable of finishing drives often stay competitive even if they lose the yardage battle.
For totals bettors, the relationship becomes even more important. Games involving two efficient red-zone offenses can exceed expectations without producing extraordinary yardage totals. On the other hand, contests featuring offenses that repeatedly settle for three points may stay under the posted total despite plenty of offensive movement.
When you begin evaluating games through this lens, you’ll notice that some offenses consistently outperform what their yardage totals suggest. Those are often the teams capable of surprising the betting market over the course of a season.
Using Red Zone TD Percentage to Find Betting Value
Statistics become most valuable when they help identify situations where the betting market may be overlooking something important. Red zone touchdown percentage is particularly useful because it provides insight into an offense’s ability to finish drives rather than simply move the football.
Instead of looking at offensive statistics in isolation, compare one team’s offensive red-zone efficiency against its opponent’s defensive performance inside the 20-yard line. This creates a more complete picture of how the matchup may unfold.
Suppose Team A converts touchdowns on 71 percent of its red-zone trips. This indicates an offense that consistently capitalizes once it reaches scoring position.
Now suppose Team B allows touchdowns on 69 percent of opponents’ red-zone possessions. That defensive weakness aligns directly with Team A’s greatest strength.
Even if Team A ranks only in the middle of the league in total offense, this matchup suggests it could finish drives at a higher-than-normal rate.
The opposite situation can also reveal value.
Imagine a team averaging nearly 400 yards per game while converting only 48 percent of its red-zone opportunities into touchdowns. If that offense is about to face one of the league’s best red-zone defenses, there is reason to believe those impressive yardage totals may not translate into enough points to cover the spread.
This type of analysis often helps explain why some games produce unexpected results. Bettors who focus only on offensive rankings may overlook an important mismatch that becomes obvious once red-zone efficiency is considered.
Another useful approach is to study trends over several weeks rather than relying on season-long averages alone. Teams frequently improve or decline as the season progresses due to injuries, coaching adjustments, or changes in personnel.
For example, an offense that struggled during the first month of the season may experience significant improvement after a young quarterback gains confidence or an injured offensive lineman returns to the starting lineup. Season averages sometimes hide these recent developments.
Likewise, a defense that loses a key linebacker or safety may become far less effective near the goal line. Watching only overall defensive rankings might cause bettors to miss that change.
Another factor worth evaluating is opponent quality. Some teams build impressive red-zone statistics against weaker defenses early in the schedule before facing much tougher competition later in the year.
Ask yourself questions such as:
- Did this offense produce those numbers against playoff-caliber defenses or struggling teams?
- Has the defense recently faced elite quarterbacks, or has its schedule been relatively easy?
- Are the current statistics supported by consistent performances over multiple weeks?
Answering those questions helps determine whether a team’s red-zone numbers are sustainable or inflated by favorable circumstances.
You’ll also find that certain coaching staffs consistently excel in red-zone situations. Offensive coordinators who design creative formations and maximize their personnel often produce reliable results year after year. Recognizing those tendencies can provide another small advantage when evaluating matchups.
This is where NFL red zone touchdown percentage betting becomes much more than simply checking a statistic. It becomes part of a broader handicapping process that compares strengths against weaknesses while considering recent performance, injuries, coaching, and schedule quality.
The goal isn’t to replace traditional statistics. Instead, it’s to use red-zone efficiency to better understand how those statistics are likely to translate into actual points.
Combine Red Zone TD Percentage With Other Statistics
Although red-zone touchdown percentage is extremely valuable, no single statistic should determine every betting decision. Football is far too complex for one number to explain every outcome. The strongest handicapping approach combines several complementary statistics that work together to tell a more complete story.
One of the first statistics worth pairing with red-zone efficiency is third-down conversion percentage. Teams that consistently convert third downs extend drives and create additional opportunities to reach scoring position. An offense that excels on third down and also scores touchdowns inside the red zone is often capable of sustaining long, productive drives throughout the game.
Turnover margin should also remain part of your weekly analysis. Even the most efficient red-zone offense cannot score if it continually gives away possessions. Teams that protect the football while forcing takeaways naturally create more opportunities to capitalize on their red-zone strengths.
Explosive plays deserve attention as well. Long completions and breakaway runs frequently move offenses into scoring territory with just one snap. An offense capable of generating explosive plays while maintaining strong red-zone efficiency can become extremely difficult for opposing defenses to contain.
Offensive line play is another important consideration. Goal-line situations often come down to physical execution at the line of scrimmage. Teams with dominant offensive lines generally have greater success converting short-yardage situations into touchdowns, particularly late in games when defenses begin to tire.
Quarterback style can influence red-zone success, too. Mobile quarterbacks add another dimension because defenses must account for designed runs, scrambles, and extended plays. Pocket passers can certainly thrive as well, but mobility often creates additional scoring options when space becomes limited.
Injury reports should never be ignored. Losing a starting tight end, power running back, or left tackle can significantly reduce an offense’s effectiveness near the goal line. Likewise, injuries to linebackers or defensive linemen may weaken a defense’s ability to stop short-yardage rushing attempts.
Rather than viewing these statistics independently, think of them as pieces of a puzzle. When multiple indicators point in the same direction, confidence in your analysis naturally increases.
For example, imagine an offense that:
- Converts third downs at a high rate.
- Protects the football well.
- Generates explosive plays.
- Possesses a strong offensive line.
- Ranks among the league leaders in red-zone touchdown percentage.
That combination paints a much clearer picture than any single statistic could provide on its own.

Teams That Often Outperform Their Yardage
Every NFL season includes teams that seem to score far more points than their total offensive rankings would suggest. They may finish the game with only average yardage totals, yet somehow end up with 30 or more points on the scoreboard.
These teams often share one characteristic: they maximize nearly every scoring opportunity.
Their drives are efficient rather than flashy. Instead of relying on repeated explosive plays, they avoid penalties, limit turnovers, execute well on third down, and finish possessions with touchdowns.
As a result, they consistently outperform expectations created by traditional offensive statistics.
The opposite type of team also appears every season.
These offenses produce highlight-reel plays and impressive yardage totals but frequently disappoint bettors because they fail to finish drives. They may rank near the top of the league in total offense while remaining surprisingly average in points scored.
Understanding the difference between those two profiles can improve your ability to identify betting value before the market fully adjusts.
When reviewing weekly statistics, don’t stop after looking at total yards gained. Ask yourself whether those yards consistently translate into touchdowns. If they do, the offense may be stronger than the public realizes. If they don’t, impressive offensive rankings may be hiding a significant weakness.
Over the course of an entire NFL season, those differences often become the deciding factor between teams that regularly cover the spread and teams that continually frustrate bettors despite posting attractive offensive numbers.
Common Betting Markets That Benefit
One of the biggest advantages of studying red zone touchdown percentage is that it can improve your analysis across several different betting markets. While many statistics are most useful for one specific type of wager, this metric can influence point spreads, totals, team totals, and even live betting decisions. The key is understanding how finishing drives with touchdowns affects the scoreboard and applying that information appropriately.
When evaluating a game, begin by considering which betting markets are most likely to be influenced by offensive efficiency inside the 20-yard line. Looking at red zone touchdown percentage alongside the betting line often provides a clearer picture than relying on offensive yardage alone.
Point Spread Bets
Point spreads are often decided by one or two possessions, making touchdown efficiency especially important.
Suppose a favorite is laying 6.5 points. If that team consistently converts red-zone trips into touchdowns while its opponent frequently settles for field goals, the favorite has a better chance of extending its lead beyond one score.
On the other hand, if a heavily favored offense struggles to finish drives, it may dominate the stat sheet while still allowing an underdog to remain within the number. Bettors who recognize this possibility before kickoff may find value that isn’t immediately obvious from total offensive rankings.
When studying spreads, compare each team’s offensive red-zone percentage with the opposing defense’s ability to prevent touchdowns. This simple comparison often provides another layer of confidence before placing a wager.
Team Totals
Team totals are another market where red-zone efficiency deserves close attention.
Oddsmakers set team totals based on expected scoring output rather than projected yardage. An offense that routinely turns red-zone opportunities into seven points instead of three naturally has a better chance of exceeding its team total.
Likewise, if an offense has struggled all season to finish drives and is facing a defense that performs well near the goal line, the Under on that team’s total may deserve consideration.
Rather than asking, “Will this team move the football?” ask yourself, “Will this team finish enough drives with touchdowns?” That small change in thinking can produce more informed betting decisions.
Game Totals
Red-zone efficiency also plays an important role when evaluating game totals.
Many bettors assume high-yardage offenses automatically create high-scoring games. While that certainly happens, the relationship isn’t always as strong as expected.
Two teams can combine for more than 800 yards yet finish Under the total if several long drives end with field goals or turnovers.
At the same time, two efficient offenses may score well into the 30s despite producing only average yardage because nearly every scoring opportunity results in a touchdown.
When handicapping totals, study both offenses and both defenses. If each offense ranks well in red-zone touchdown percentage while each defense struggles inside the 20-yard line, scoring could exceed expectations.
Live Betting
Live betting provides another opportunity to use this statistic effectively.
Imagine watching the first quarter of a game where one offense repeatedly drives inside the opponent’s 25-yard line but comes away with only field goals. Some bettors immediately assume the offense is having a disappointing day.
However, if the offense continues moving the ball with ease, there is reason to believe touchdowns may eventually follow, especially if the underlying execution remains strong.
The opposite situation also deserves attention.
If an offense scores an early touchdown despite struggling to sustain drives, that success may not continue throughout the game.
Watching how teams reach the red zone—and how they perform once they get there—can help identify live betting opportunities before the market fully adjusts.
Common Mistakes Bettors Make
Like every statistic, red-zone touchdown percentage becomes most valuable when it is used correctly. Many bettors either ignore it completely or rely on it without considering the broader context. Avoiding a few common mistakes can help you get much more out of this metric.
One of the biggest errors is focusing only on offensive red-zone percentage while ignoring defensive performance. Football is always about matchups. An offense that scores touchdowns at an excellent rate may face one of the league’s toughest red-zone defenses, making those season-long numbers less predictive for that particular game.
Another mistake is relying entirely on season averages without considering recent performance.
NFL teams evolve throughout the year. Injuries, coaching adjustments, quarterback development, and schedule strength all influence offensive efficiency. A statistic from Week 2 may not accurately represent a team entering Week 14.
It is also important to consider the quality of opponents.
A team may post outstanding red-zone numbers after facing several defenses that struggled all season. Those same numbers become less impressive if the upcoming opponent consistently ranks among the league’s best inside the 20-yard line.
Personnel changes deserve careful attention as well.
Goal-line situations often depend on players who may not receive much national attention. Losing a starting center, a blocking tight end, or a powerful short-yardage running back can reduce touchdown efficiency more than many bettors realize.
Weather is another factor worth monitoring.
Heavy rain, snow, or strong winds often make offensive execution more difficult, particularly near the goal line where passing windows are already limited. While talented offenses can still score, weather occasionally shifts the advantage toward physical running games and strong defensive fronts.
Finally, avoid making decisions based on a single statistic.
Successful NFL handicapping combines multiple pieces of information. Red-zone touchdown percentage should complement your evaluation of injuries, turnovers, offensive line play, quarterback performance, coaching tendencies, and schedule strength.
When several factors point in the same direction, your analysis becomes much stronger than relying on one number alone.
Where to Find Red Zone Statistics
Finding reliable red-zone statistics is much easier today than it was several years ago. Numerous football websites publish offensive and defensive efficiency metrics each week, allowing bettors to compare teams before placing wagers.
The official NFL statistics pages provide updated team and individual numbers throughout the season. These are excellent starting points because they are accurate and easy to verify.
Sports-reference websites also organize historical data that allows bettors to compare current performance with previous seasons. Looking at long-term trends can help identify teams that consistently perform well in the red zone under the same coaching staff.
Advanced football analytics websites often go even deeper by breaking down offensive production based on formation, personnel, field position, and situational football. While these resources can be extremely useful, remember that more data is not always better. Focus on statistics that directly improve your handicapping rather than collecting numbers simply because they are available.
As you build your weekly routine, consider tracking a small group of related statistics instead of dozens of different categories.
For example, each week you might record:
- Offensive red-zone touchdown percentage.
- Defensive red-zone touchdown percentage allowed.
- Third-down conversion percentage.
- Turnover margin.
- Yards per play.
- Injury updates affecting offensive or defensive personnel.
Keeping these numbers in one spreadsheet allows you to compare matchups quickly and notice trends that may not be obvious from week to week.
Over time, this process becomes much faster and can provide a consistent framework for evaluating every NFL game on the schedule.
Final Thoughts
Many NFL bettors naturally focus on total offense because it is one of the easiest statistics to find and one of the most frequently discussed by television analysts. While total yards certainly provide useful information, they do not always tell the complete story.
Football games are ultimately decided by points, not by who gains the most yardage. An offense that consistently converts scoring opportunities into touchdowns often creates larger margins of victory, improves its chances of covering the spread, and places constant pressure on opposing teams.
That is why NFL red zone touchdown percentage betting deserves a place in every bettor’s handicapping process. By looking beyond traditional offensive rankings and evaluating how efficiently teams finish drives, you can develop a better understanding of which offenses are built to capitalize on opportunities and which ones leave too many points on the field.
This statistic should never be viewed in isolation. Combine it with third-down efficiency, turnover margin, offensive line play, injuries, weather conditions, coaching tendencies, and recent performance to build a more complete picture of each matchup. Small advantages across several categories often produce better long-term betting decisions than relying on one headline statistic.
No single metric guarantees winning wagers, but learning to evaluate offensive efficiency where it matters most can help you see games from a different perspective than many casual bettors. Over the course of a long NFL season, that additional insight may be enough to uncover value that isn’t immediately reflected in the betting market. As part of a disciplined handicapping routine, NFL red zone touchdown percentage betting can become another useful tool in your ongoing effort to make smarter and more informed NFL wagers.
Before You Go…
Get Weekly Winning Angles Delivered to You
Enjoy this article? Join the Core Sports Betting newsletter where we break down actionable strategies, betting angles, and real-game insights.
Some of the concepts we touch on each week can evolve into full handicapping systems – the kind you can test, refine, and potentially build into long-term edges.
Simple. Practical. No fluff.
Proven Sports Betting Courses
Looking to go deeper?
Our step-by-step courses are built around structured systems – not guesses or opinions. Each course has been backtested over a minimum of 10 years, giving you a clear understanding of how the strategy has performed over time.
If you’re serious about improving your process, these courses show you exactly how to approach betting with discipline and structure.
Free Betting Calculators to Sharpen Your Edge
Want to make smarter, faster decisions?
Our free tools help you quickly calculate odds, payouts, and true value — without the guesswork.
Try these popular calculators:
- Moneyline Calculator
- Parlay Calculator
- No-Vig Odds Calculator (Find True Odds)
- Kelly Criterion Calculator
→ Visit the Betting Tools Hub to access all calculators
Like this article? Pin it on Pinterest!

More to Explore



Comments (1)
Comments are closed.
[…] Finishing drives remains one of the most important aspects of winning football games. […]