Winning sports bettors do not necessarily avoid losing streaks. In fact, anyone who places enough wagers…
NBA Effective Field Goal Percentage Betting: Why eFG% Is Better Than FG%

When evaluating NBA teams, shooting percentage is one of the first statistics many basketball bettors examine. A team shooting 48% from the field might appear more efficient than one shooting 45%, but those numbers do not tell the entire story. The NBA effective field goal percentage statistic provides a more accurate way to measure shooting efficiency because it accounts for the additional value of three-point baskets. For bettors trying to understand offensive performance, defensive weaknesses, and potential matchup advantages, this distinction can be extremely useful.
Modern NBA offenses rely heavily on three-point shooting, floor spacing, and creating high-quality scoring opportunities. A team that makes fewer baskets can sometimes generate more points from its field goal attempts simply because a greater percentage of its successful shots come from beyond the three-point line.
Understanding effective field goal percentage, commonly abbreviated as eFG%, can help bettors look beyond traditional box scores and evaluate how efficiently teams convert their shooting opportunities into points. Although no single statistic can consistently predict the outcome of an NBA game, eFG% provides valuable information that traditional field goal percentage often overlooks.
What Is Effective Field Goal Percentage in the NBA?
Effective field goal percentage is an advanced basketball statistic that measures shooting efficiency while accounting for the fact that three-point baskets are worth more than two-point baskets.
Traditional field goal percentage treats every made basket equally. A successful layup counts the same as a successful three-pointer, even though the three-pointer produces an additional point. Effective field goal percentage adjusts for this difference, giving bettors a more meaningful picture of how efficiently a team scores from the field.
The formula for effective field goal percentage is:
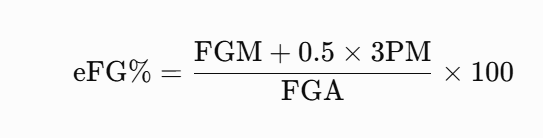
In this formula, FGM represents total field goals made, 3PM represents three-point field goals made, and FGA represents total field goal attempts. The additional 0.5 multiplier gives proper credit for the extra point generated by each successful three-pointer.
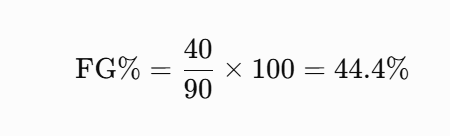
Consider a team that makes 40 field goals on 90 attempts, including 15 successful three-pointers.
Its traditional field goal percentage would be:
However, its effective field goal percentage would be:
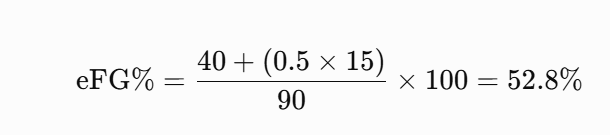
The difference is substantial. Although the team made only 44.4% of its shots, its three-point production increased the scoring value of those successful attempts.
For bettors, the important takeaway is that eFG% measures points generated per field goal attempt more effectively than traditional FG%. In fact, multiplying eFG% by two gives a team’s points per field goal attempt, excluding free throws.
This makes eFG% especially useful when comparing teams with different offensive styles.
eFG% vs. FG%: Why Traditional Field Goal Percentage Can Be Misleading
Traditional field goal percentage remains useful for understanding how frequently a team makes its shots. However, it does not distinguish between two-point and three-point baskets, which can create misleading comparisons between teams.
Imagine two NBA teams playing on the same night. Both attempt 80 field goals and make 36 baskets. Looking only at traditional shooting percentages, their performances appear identical.
However, one team makes considerably more three-pointers.
The following hypothetical comparison demonstrates how those differences affect scoring efficiency.
| Statistic | Team A | Team B |
| Field goal attempts | 80 | 80 |
| Field goals made | 36 | 36 |
| Three-pointers made | 8 | 16 |
| Traditional FG% | 45.0% | 45.0% |
| Effective FG% | 50.0% | 55.0% |
| Points from field goals | 80 | 88 |
Both teams finished with identical traditional field goal percentages, but Team B generated eight additional points from the same number of shooting attempts.
That difference could be meaningful in an NBA game with a point spread of only a few points.
Of course, the comparison does not account for free throws, turnovers, offensive rebounds, or other factors that determine the final score. Nevertheless, it illustrates why effective field goal percentage is generally a better measure of shooting efficiency.
Why Three-Point Shooting Changes the Evaluation
A team shooting 35% from three-point range produces 1.05 points per three-point attempt. A team shooting 50% on two-point attempts produces 1.00 point per attempt.
Although the three-point percentage looks much lower, the three-point attempts are slightly more productive in this example.
This does not mean three-pointers are always better shots. A layup attempted near the basket might have a much higher probability of success, while a contested three-pointer could be an inefficient offensive decision.
Shot quality, defensive pressure, player ability, and location all influence whether an attempt is worthwhile.
Effective field goal percentage captures the scoring value of successful shots without requiring bettors to evaluate every attempt individually.
For this reason, eFG% is especially helpful when comparing offenses built around different shot distributions.
How to Use Effective Field Goal Percentage in NBA Betting
Understanding NBA effective field goal percentage becomes particularly valuable when the statistic is incorporated into a broader betting analysis. Rather than simply identifying the team with the higher eFG%, bettors can examine how offensive and defensive shooting efficiency interact within a particular matchup.
There are several practical ways to incorporate this statistic into the evaluation process.
Compare Offensive Shooting Efficiency
The first step is to examine each team’s offensive eFG% over a meaningful sample of games.
Suppose Team A has a season-long eFG% of 56%, while Team B has an eFG% of 52%. This suggests Team A has generated more points per field goal attempt throughout the season.
However, that difference should not automatically lead to a wager on Team A.
The bettor should determine whether the higher percentage reflects sustainable offensive strengths, such as consistent shot creation, strong three-point shooting, or effective scoring near the basket.
It is also important to consider the quality of opposing defenses. A team that recently faced several weak defensive opponents might have temporarily inflated shooting statistics.
A practical approach is to compare season-long offensive eFG% with performance over the previous 10 games. This can reveal whether a team is performing near its established level or experiencing an unusual stretch of shooting results.
Examine Defensive eFG% Allowed
Offensive efficiency tells only part of the story. Defensive effective field goal percentage measures how efficiently opponents shoot against a particular team.
A defense allowing an opponent eFG% of 51% has generally limited shooting efficiency more effectively than one allowing 56%.
This distinction becomes especially interesting when a strong shooting offense faces a defense that consistently permits efficient scoring opportunities.
For example, consider an offense with a 56% eFG% facing a defense that allows opponents to shoot 55% eFG%.
That matchup may be favorable for the offense, particularly if the defense struggles to protect the basket or prevent open three-point attempts.
However, the bettor should also consider whether those weaknesses match the offensive team’s preferred style.
A team that relies heavily on interior scoring might not benefit as much from facing a defense whose primary weakness is defending three-pointers.
Compare Offensive and Defensive Matchups
One useful approach is to evaluate each team’s offensive eFG% alongside the opponent’s defensive eFG% allowed.
This comparison provides a starting point for identifying possible shooting advantages.
Suppose Team A has a 55% offensive eFG% and faces Team B, which allows a 56% defensive eFG%. Meanwhile, Team B has a 51% offensive eFG% and faces Team A, which allows only 52%.
Team A appears to have the stronger shooting matchup on both sides of the court.
However, these numbers should not simply be averaged to predict the teams’ actual shooting percentages. Opponent quality, home-court conditions, player availability, and offensive style can influence the expected results.
Instead, use the comparison to identify which team deserves closer examination before evaluating the betting market.
Review Recent Shooting Performance
Season averages provide useful context, but recent performance can reveal changes that are not immediately apparent in full-season statistics.
A team may have changed its starting lineup, lost an important defender, or adjusted its offensive approach. Those developments can influence shooting efficiency.
For example, a team averaging 53% eFG% throughout the season might have recorded 57% over its previous 10 games.
Before interpreting that improvement as meaningful, investigate what caused it.
Was an injured scorer recently reintroduced into the lineup? Has the team increased its attempts near the basket? Are opponents allowing unusually open shots? Or has the team simply experienced a temporary stretch of excellent three-point shooting?
Recent statistics are most useful when supported by identifiable basketball reasons.
A strong betting analysis considers both the numbers and the circumstances producing them.
Can eFG% Help Identify NBA Betting Value?
Effective field goal percentage can help bettors evaluate team performance, but identifying a statistical advantage is not the same as identifying a profitable betting opportunity.
Sportsbooks establish betting lines based on expected game outcomes, market activity, and numerous statistical factors. Strong offensive shooting efficiency may already be reflected in a team’s point spread, moneyline price, or game total.
The goal is therefore not simply to find the better shooting team. It is to determine whether the available betting price accurately reflects the matchup.
Using eFG% for Point Spread Betting
Point spread betting requires evaluating not only which team is more likely to win, but also the expected margin of victory.
Suppose Team A has a clear shooting-efficiency advantage over Team B. That information may support the idea that Team A can generate points more efficiently.
However, if Team A is favored by 12 points, the advantage might already be fully accounted for in the spread.
A bettor considering that wager should estimate whether the shooting advantage, combined with other factors, supports a projected winning margin greater than the sportsbook’s line.
For example, if a bettor’s independently developed projection favors Team A by seven points while the sportsbook lists Team A at -4.5, there may be a reason to investigate further.
The key is having a reliable projection rather than assuming that a higher eFG% automatically justifies betting the favorite.
Using eFG% for Moneyline Betting
Moneyline wagers focus on which team wins the game outright.
Because shooting efficiency contributes significantly to offensive production, eFG% can help bettors compare the underlying strength of two teams.
However, a team with a higher eFG% may still lose because of turnovers, offensive rebounding disadvantages, free-throw differences, or poor late-game execution.
Moneyline betting also requires considering the price.
A team might have a strong chance of winning but still represent poor betting value if the odds are too expensive.
For example, a moneyline price of -200 requires a win probability greater than approximately 66.7% to have positive expected value before accounting for other considerations.
Effective field goal percentage can contribute to estimating that probability, but it cannot determine it independently.
Using eFG% for NBA Totals Betting
Game totals are another area where shooting efficiency can be useful.
A matchup involving two efficient offenses and vulnerable defenses might suggest the potential for strong scoring production.
However, game pace is equally important.
An efficient offense playing slowly may generate fewer total points than a less efficient offense that produces considerably more possessions.
A useful starting framework is:

Effective field goal percentage can help inform expected offensive efficiency, but it must be combined with turnovers, rebounding, free throws, and other scoring factors to develop a complete projection.
This is particularly important when evaluating totals, where both the number of possessions and the efficiency of those possessions influence the final result.

Why eFG% Should Not Be Used Alone
Although effective field goal percentage is a valuable measure of shooting efficiency, it does not account for every aspect of basketball performance. A team can shoot more efficiently than its opponent and still lose because it performs poorly in other areas.
Basketball analyst Dean Oliver identified four important factors in evaluating team performance: effective field goal percentage, turnovers, rebounding, and free throws. These factors provide a more complete framework for understanding how teams win games.
For bettors, combining eFG% with additional statistics can help prevent misleading conclusions.
Pace and Possessions
Pace measures the approximate number of possessions a team plays per 48 minutes.
A fast-paced team may attempt more shots and score more points despite having a lower effective field goal percentage. A slower team may shoot extremely efficiently but produce fewer scoring opportunities.
This distinction matters when evaluating both point spreads and game totals.
When analyzing a matchup, compare each team’s pace and consider how the two playing styles might interact. A team that prefers to run may struggle to maintain its usual tempo against an opponent that consistently slows the game.
Turnover Percentage
Turnovers eliminate scoring opportunities before a shot can even be attempted.
A team with excellent shooting efficiency may struggle offensively if it frequently loses possession of the basketball.
For example, imagine a team that shoots 57% eFG% but commits 19 turnovers. Its shooting performance might be impressive, but those lost possessions could significantly reduce its total scoring output.
Reviewing turnover percentage alongside eFG% helps determine whether a team is efficiently converting its available possessions into scoring opportunities.
Offensive Rebounding
Offensive rebounds provide additional opportunities to score after missed shots.
A team with a lower eFG% can sometimes compensate by collecting offensive rebounds and generating second-chance points.
This is particularly relevant when a strong offensive rebounding team faces an opponent that struggles to secure defensive rebounds.
Bettors should examine offensive rebounding percentage rather than relying exclusively on total rebound counts, which can be influenced by the number of missed shots in a game.
Free-Throw Production
Effective field goal percentage does not include free throws.
This creates an important limitation when comparing teams that rely on different scoring methods.
A team that frequently attacks the basket and draws fouls may produce excellent offensive results without having an especially high eFG%.
Free-throw attempt rate helps identify how frequently teams reach the foul line relative to their field goal attempts.
When evaluating a matchup, consider whether one team has a meaningful advantage in generating free throws and whether the opposing defense frequently commits fouls.
eFG% vs. True Shooting Percentage
True shooting percentage, or TS%, is another useful measure of scoring efficiency.
While eFG% accounts for two-point and three-point field goals, true shooting percentage also incorporates free throws.
The NBA defines true shooting percentage using points scored, field goal attempts, and an adjustment for free-throw attempts.
Neither statistic makes the other unnecessary.
Effective field goal percentage is particularly useful for evaluating how efficiently teams shoot from the floor. True shooting percentage provides a broader measure of scoring efficiency that includes free-throw production.
For a complete betting analysis, both statistics can be useful.
A Simple eFG% NBA Betting Analysis Example
One of the best ways to understand how effective field goal percentage can influence betting decisions is to examine a hypothetical matchup.
Suppose Team A is playing Team B in a regular-season NBA game. Both teams are relatively healthy, and neither has a significant rest disadvantage.
The following statistics represent their season-long performances.
| Statistic | Team A | Team B |
| Offensive eFG% | 56% | 52% |
| Defensive eFG% allowed | 53% | 55% |
| Pace | 100 | 97 |
| Turnover percentage | 12% | 14% |
| Offensive rebounding percentage | 27% | 30% |
At first glance, Team A appears to have several advantages.
Its offense shoots more efficiently, its defense allows a lower effective field goal percentage, and it turns the ball over less frequently.
Team B, however, has the stronger offensive rebounding percentage, which could help offset some of its shooting disadvantage.
Step 1: Evaluate the Shooting Matchup
Team A’s 56% offensive eFG% is encouraging, especially against a defense allowing opponents to shoot 55%.
Meanwhile, Team B’s 52% offensive eFG% faces a defense allowing only 53%.
These numbers suggest Team A may have a meaningful shooting advantage.
However, before making a betting decision, investigate whether the percentages were produced against comparable competition and whether either team’s lineup has changed.
Step 2: Consider Possession Differences
Team A plays at a slightly faster pace and commits fewer turnovers.
That combination could help it generate additional scoring opportunities.
However, Team B’s superior offensive rebounding could reduce that advantage by creating second-chance possessions.
A complete projection should consider how these factors interact rather than treating each statistic independently.
Step 3: Compare the Analysis With the Betting Line
Suppose the sportsbook lists Team A as a 6.5-point favorite.
The shooting statistics favor Team A, but do they justify laying 6.5 points?
That question cannot be answered from eFG% alone.
The bettor needs an estimate of the expected scoring margin, incorporating offensive and defensive efficiency, projected possessions, injuries, home-court advantage, and other relevant factors.
If the resulting projection favors Team A by only four points, the shooting advantage may not justify betting Team A at -6.5.
If a reliable model favors Team A by nine points, the wager may deserve further consideration.
Even then, a projected advantage does not guarantee a successful bet. The projection itself must be accurate enough to overcome the sportsbook’s pricing and the uncertainty inherent in individual games.
The purpose of this example is to demonstrate how shooting efficiency contributes to a betting evaluation without becoming the sole reason for placing a wager.
Frequently Asked Questions About NBA Effective Field Goal Percentage
What Is a Good Effective Field Goal Percentage in the NBA?
A good eFG% depends on the season and the league’s overall offensive environment.
Because NBA shooting efficiency changes over time, bettors should avoid using one permanent percentage as the definition of good or bad.
Instead, compare a team’s eFG% with the current league average and examine where it ranks among the 30 NBA teams.
A team shooting several percentage points above the league average is generally performing well in terms of field goal efficiency. However, the strength of its opponents and the size of the statistical sample remain important considerations.
Is eFG% Better Than True Shooting Percentage?
Neither statistic is universally better because they measure different aspects of scoring.
Effective field goal percentage focuses on shooting efficiency from two-point and three-point attempts.
True shooting percentage includes free throws, making it useful for evaluating overall scoring efficiency.
Bettors interested in understanding shot selection and field goal production may prefer eFG%, while those evaluating total scoring efficiency should also examine TS%.
Does a Higher eFG% Mean a Team Will Win?
No. A higher effective field goal percentage indicates better scoring efficiency from field goal attempts, but it does not guarantee victory.
Turnovers, rebounding, free throws, possession volume, and late-game performance can all influence the result.
A team may shoot better than its opponent and still lose because it gives away too many possessions or allows excessive second-chance points.
Effective field goal percentage should therefore be treated as an important component of team evaluation rather than a standalone prediction.
Where Can I Find NBA Effective Field Goal Percentage Statistics?
Two useful resources are NBA Stats and Basketball-Reference.
NBA Stats provides team and player statistics, including advanced and four-factor measurements. Basketball-Reference also offers historical statistical information that can help bettors compare teams across seasons.
When researching a matchup, use the same date range and statistical definitions for both teams. Comparing one team’s full-season statistics with another team’s recent 10-game performance can produce misleading conclusions.
Conclusion: Why eFG% Matters for NBA Bettors
Traditional field goal percentage remains a familiar basketball statistic, but it does not fully account for the additional scoring value of three-point baskets. NBA effective field goal percentage provides a more informative measure of shooting efficiency by adjusting for that difference.
For sports bettors, this makes eFG% particularly useful when comparing offensive performance, evaluating defensive weaknesses, and identifying potential matchup advantages.
However, effective field goal percentage should never be treated as a guaranteed betting system. Pace, turnovers, offensive rebounding, free throws, player availability, and sportsbook pricing all influence whether a statistical advantage translates into betting value.
By combining eFG% with these additional factors, bettors can develop a more complete understanding of NBA matchups and make decisions based on a broader statistical picture rather than traditional shooting percentages alone.
Before You Go…
Get Weekly Winning Angles Delivered to You
Enjoy this article? Join the Core Sports Betting newsletter where we break down actionable strategies, betting angles, and real-game insights.
Some of the concepts we touch on each week can evolve into full handicapping systems – the kind you can test, refine, and potentially build into long-term edges.
Simple. Practical. No fluff.
Proven Sports Betting Courses
Looking to go deeper?
Our step-by-step courses are built around structured systems – not guesses or opinions. Each course has been backtested over a minimum of 10 years, giving you a clear understanding of how the strategy has performed over time.
If you’re serious about improving your process, these courses show you exactly how to approach betting with discipline and structure.
Free Betting Calculators to Sharpen Your Edge
Want to make smarter, faster decisions?
Our free tools help you quickly calculate odds, payouts, and true value — without the guesswork.
Try these popular calculators:
- Moneyline Calculator
- Parlay Calculator
- No-Vig Odds Calculator (Find True Odds)
- Kelly Criterion Calculator
→ Visit the Betting Tools Hub to access all calculators
Like this article? Pin it on Pinterest!

More to Explore